What we do |
Making data work
We know that many organisations struggle to make the most of what they have.
Our work has data at its core. We can do both the heavy lifting and the delicate handling of your data.
That means sorting, organising, analysing and then connecting the dots through creative visualisation and dashboards to create clear data stories.
What sort of data are we talking about?
Some examples of data sources might be:
- Mutiple Excel sheets
- Salesforce data
- Website data
- Customer transactions
- LinkedIN data
- Data from your CRM system
- Surveymonkey results


What happens next?
We organise, sort, clean and combine so it can all work together. As well as conducting different analyses, we will report and visualise the data so that insights can be extracted and shared in your organisation.

The process in more detail
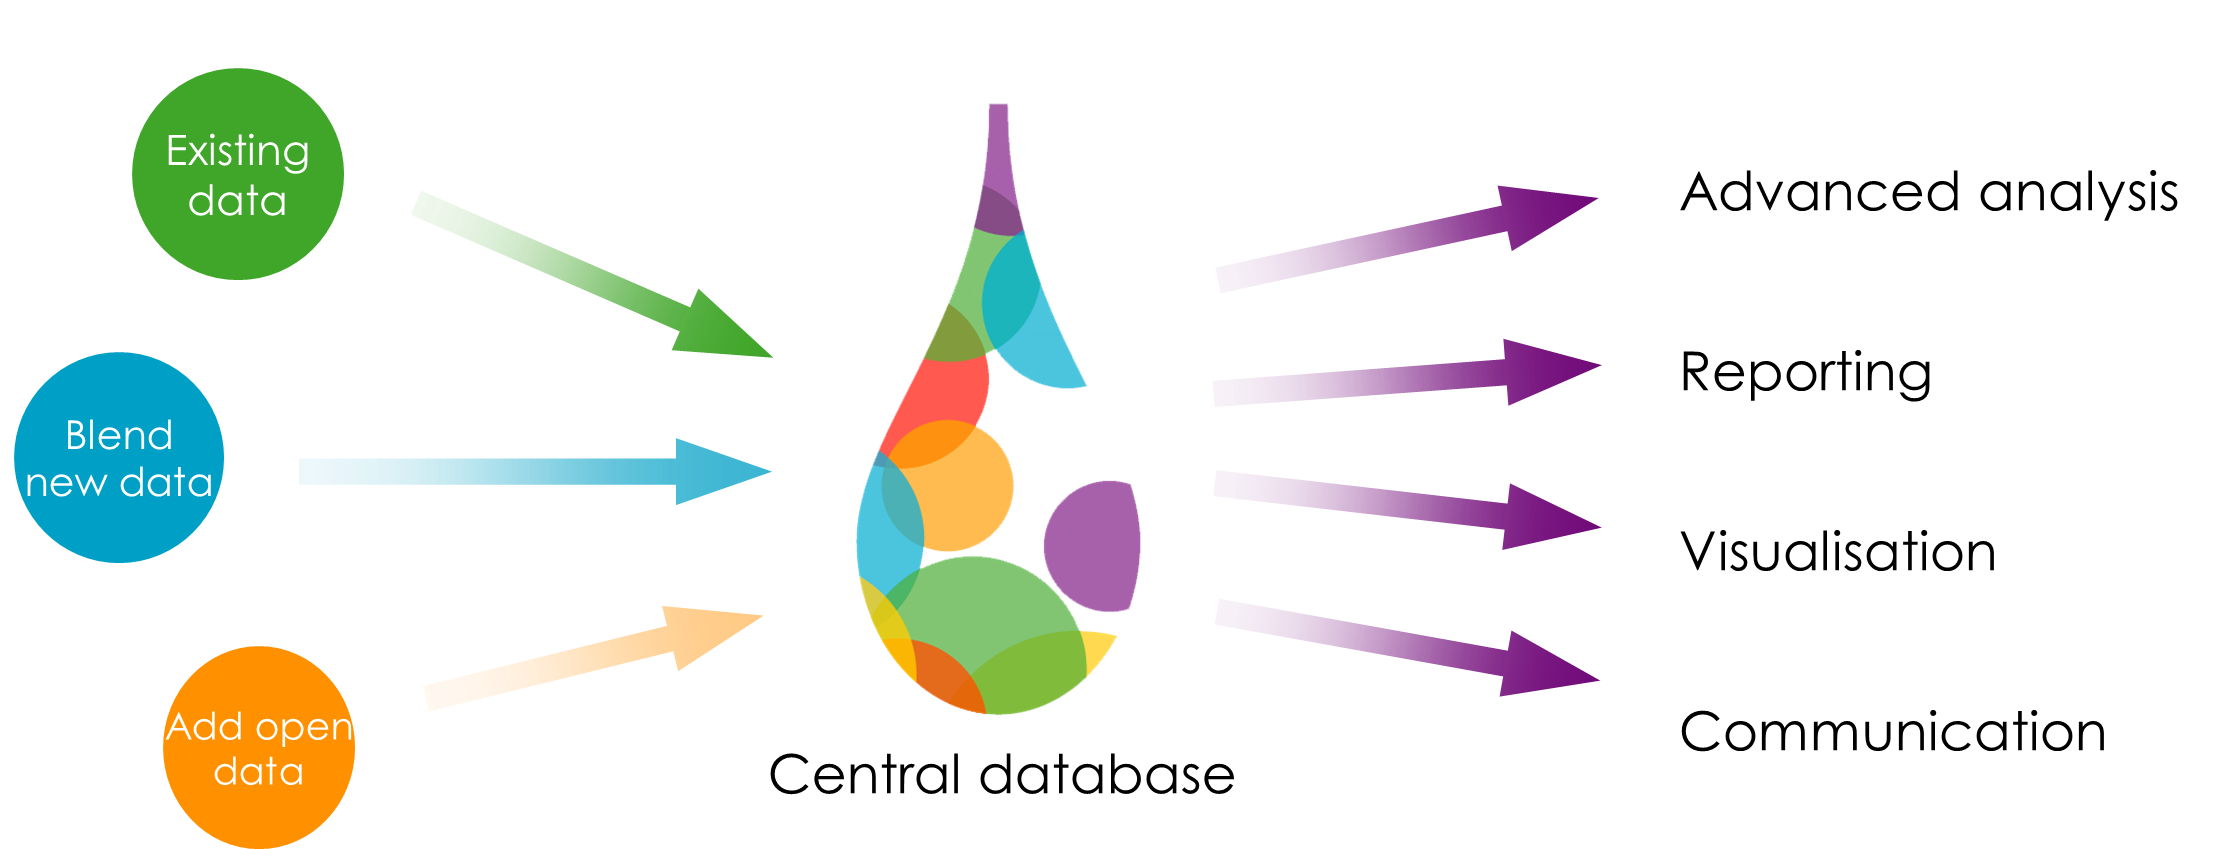
1. Mastering your data: We will combine, clean, organise and link together your own data.
2. Collecting new information: if needed - for example feedback from customers, staff, patients or other stakeholders.
3. Blending in open data: We can combining your data with open data sources to extend its power when mapping, benchmarking and modelling it.
4. Building a central database: A well-structured database for your information is the core result - once it is built the excitement begins
5. Visual data review: Our work begins with visually mapping of the information so we can all understand it.
Then more powerful data analysis can begin:
- We look at clustering and segmentation
- We build data models to explain the past and predict the future
- We forecast and simulate data
- We create analytics dashboards
- And build decision making tools
We promise to make the results clear, simple and visual so it can be understood and communicated across the organisation.